 Mowo
Debugging graphs
Set breakpoints, conditions and logpoints, step and edit live values in the editor, or attach VS Code through the built-in Debug Adapter Protocol server.
You debug a graph the way you debug code: breakpoints, a call stack, stepping and live values. There are two front ends, the Visual Scripting editor and any IDE that speaks the Debug Adapter Protocol (DAP). Both drive the same debugger in the engine.
How the debugger works
- VM reaches an exec node
- Breakpoint or step?
- Capture frame and pause
- Editor or DAP client shows it
- Resume request queued
- Game thread resumes the run
The VM calls the debugger before it runs every exec node VisualScriptVM. If the node has a breakpoint whose condition holds, or a step is in progress, the debugger captures the exec stack, node outputs and locals as frames and pauses.
The pause is cooperative. The VM returns normally with its state saved, so the game thread is never blocked and the renderer keeps drawing. Resume requests are queued, and the owner of the paused frame applies them at a safe point.
The debugger is armed only when something needs it. The editor arms it while a .vscript document is open; a DAP client arms it by attaching. With neither, breakpoint flags cost nothing.
| Command | Effect |
|---|---|
| Continue (Resume) | Run to the next breakpoint. |
| Step Over | Stop at the next node at the same frame depth or shallower. |
| Step Into | Stop at the next node at any depth, entering function calls. |
| Step Out | Run until control leaves the current frame. |
| Pause | Stop at the next exec node any graph reaches. |
| Stop | Abandon the paused run. |
These map to VisualScriptDebugger::RequestContinue, RequestStepOver, RequestStepInto, RequestStepOut, RequestBreakNext and CancelPaused VisualScriptDebugger.
Breakpoints, conditions and logpoints
Select a node and press F9, or right-click it, to toggle a breakpoint. Only nodes with an exec input take one. The context menu also offers:
- Add Conditional Breakpoint... / Edit Condition...: the breakpoint stops only when an expression is true, for example
Health < 50 && bIsAlerted. Names resolve to the paused function's parameters and locals first, then the instance's variables. A name that is not a variable is an error, not a silent zero, and a condition that cannot be evaluated stops anyway and logs why. - Add Logpoint... / Make Logpoint... / Edit Log Message...: the node prints a message instead of stopping.
{expr}placeholders are evaluated in the frame, as inhp={Health} ratio={Health / 100}. The line goes to the log and to every attached IDE's console. A logpoint may also have a condition. Make Breakpoint (Stop Here) turns it back into a stop.
The expression grammar is the one Math Expression... uses VisualScriptExpression. Breakpoints, conditions and log messages are saved in the .vscript file with the node (bp, bpCond, bpLog), so they survive a reload. On the canvas the condition or message rides on the node as a badge.
Debug in the editor
- Set a breakpoint
Press F9 on a node, or add a condition or logpoint from its context menu.
- Push the class live
Click Compile. Only a compiled class reaches the running VM.
- Run the game
Start Play-In-Editor, or click Simulate in the toolbar. Keep the class open.
- Inspect the pause
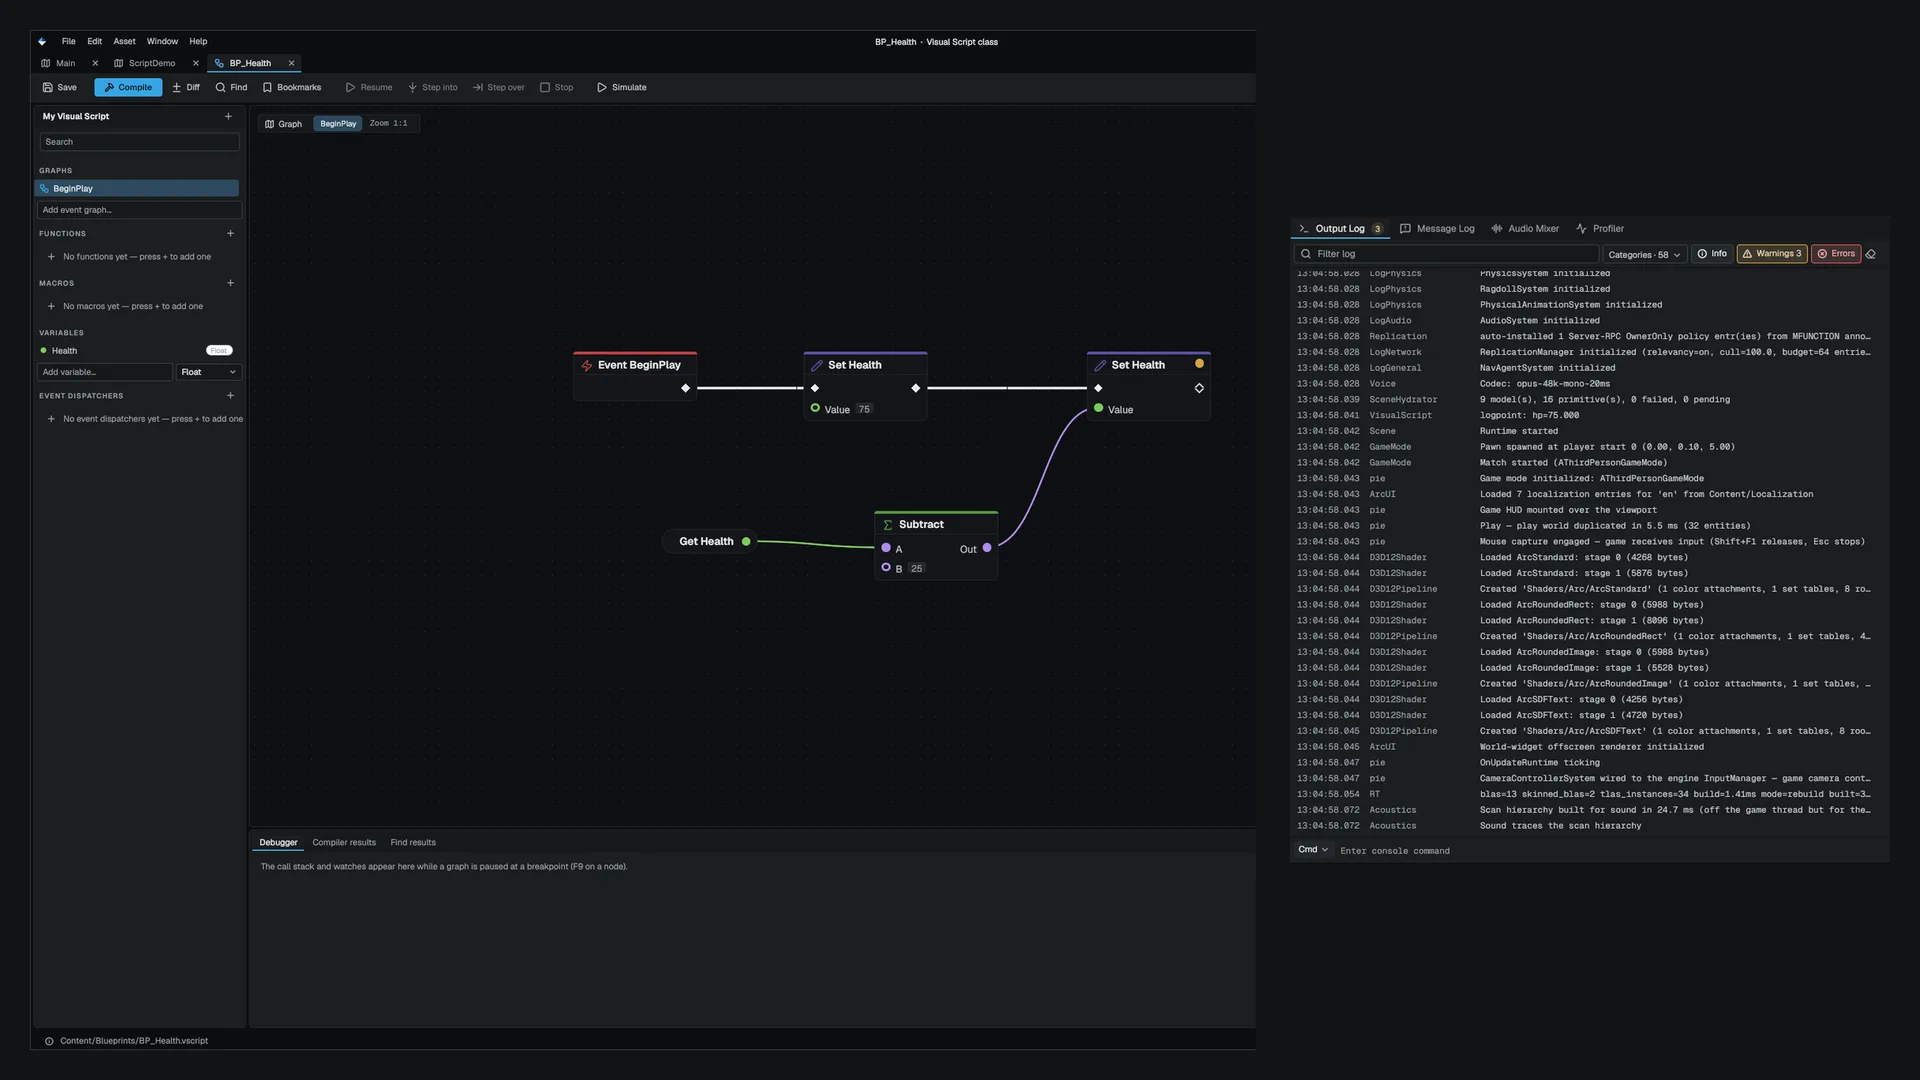
When the node is reached, the editor marks it and paints live values on output pins. The Debugger tab shows the call stack and a watch strip of the instance's variables and the current frame's locals.
- Change a value
Click a variable chip in the watch strip to set it. Numbers and bools go through the expression evaluator, so
Health - 10works; vectors takex, y, z; strings take the text as typed; an object variable can only be cleared. Pin values are computed, so they are read-only VisualScriptDebugger::SetVariable. Resuming runs on with the edited value, so you can steer a run past a branch without recompiling. - Step or resume
Use Resume, Step into, Step over or Stop in the toolbar.
While the game runs, nodes that executed in the last 0.6 seconds pulse on the canvas, so you can watch execution move through the graph.
The DAP server
The same debugger is available to any IDE that speaks DAP. Start the editor or a game with --visual-script-dap:
.\MowoEditor.exe --project D:\Games\MyGame\MyGame.mproject --visual-script-dap
.\MyGame.exe --visual-script-dap=4711- Bare
--visual-script-dapuses port 4711. - The server binds the loopback address only,
127.0.0.1, because a debug adapter reachable from the network would be a remote-code-execution surface. - It accepts one client at a time.
- Without the switch nothing starts: no thread, no socket.
When it starts, the log shows:
[VisualScriptDAP] Visual Script debug adapter listening on 127.0.0.1:4711 — attach an IDE with the "mowo-visual-script" debug typeThe DAP server is compiled out of release and profile builds. The --visual-script-dap check sits inside #if !MOWO_BUILD_RELEASE, so a retail game cannot be made to open a debug port, however it is launched.
Socket reads run on a worker thread that only parses frames and queues them. Every protocol decision runs on the game thread, because the debugger's pause state belongs to the thread that runs graphs.
Attach VS Code
VS Code connects straight to the engine's socket through the mowo-visual-script debug extension, with no adapter process in between.
The VS Code extension is not part of the installed editor build yet, so the steps below need a copy of it from the Mowo team.
- Build the extension
In the extension's folder, run
npm install, thennpm run compile. - Load it
Open that folder in VS Code and press F5 to start an Extension Development Host. Or copy the folder to
%USERPROFILE%\.vscode\extensions\mowo-visual-script(~/.vscode/extensions/mowo-visual-scripton macOS and Linux) and restart VS Code. - Start the engine
Launch the editor or game with
--visual-script-dap. - Attach
Add the configuration below to
.vscode/launch.jsonand start it.
{
  "type": "mowo-visual-script",
  "request": "attach",
  "name": "Attach to Mowo (Visual Scripting)",
  "host": "127.0.0.1",
  "port": 4711
}
The attach configuration also accepts stopOnEntry, to break on the first node after attaching. While attached, Run and Debug > Visual Script Graphs lists every registered class. Click one to open its listing and set breakpoints, conditions and logpoints in the gutter.
For Visual Studio or Rider, run the process under the native debugger with --visual-script-dap in its arguments, and attach VS Code alongside for graph-level debugging.
From graph to lines
A .vscript asset is a graph, but DAP thinks in lines. The adapter bridges the two with a generated text listing of each class, built from the same in-memory class the VM runs, so a line and the node it names cannot drift apart VisualScriptTextView. For the sample BP_Door class it starts like this:
class BP_Door : AActor

event OnInteract
  0: Event OnInteract -> 1
  1: Branch -> 4 else 6
  2: CallGraphFunction IsPlayerInRange
  3: GetVar TriggerRadius
  4: CallGraphFunction OpenDoor
  5: GetVar OpenSpeed
  6: CallGraphFunction CloseDoor
  7: Comment Door open / close logic
end

function OpenDoor(Speed: Float)
  0: Event OpenDoor -> 2
  1: Return
  2: SetVar IsOpen -> 1
end- The first line names the class and its parent. The second is blank.
- Each graph is a section: a header (
event,functionwith its signature, ormacro), one line per node in index order,end, and a blank line. - Events come first, then functions, then macros.
-> Nis the next exec node,else Nthe second exec output,[i]-> Na list output.- A breakpoint on a header, blank or
endline moves forward to the next node line, and the adapter reports the adjusted line.
The listing is served through the DAP source request with MIME type text/x-vscript. Source objects carry no path on purpose: the line numbers of the raw .vscript file describe the MDF document, not the graph.
Supported DAP requests
| Request | Behavior |
|---|---|
initialize | Reports support for configurationDone, evaluate-for-hovers, terminate, loaded sources, conditional breakpoints, logpoints and setVariable. |
attach, launch | Both attach to the running process and arm the debugger. |
setBreakpoints | Replaces the class's breakpoints, with each entry's condition and logMessage. A condition that does not parse is refused as unverified. |
setVariable | Sets a value in the Locals or Instance variables scope. Pin values are read-only. |
threads | One thread: the game thread that runs graphs. |
stackTrace | One frame per debug frame, on the paused node's line. |
scopes, variables | Locals, Instance variables, Pin values. |
continue, next, stepIn, stepOut, pause | The debugger commands above. |
evaluate | A name reads a local, then an instance variable. #4 reads node 4's first output; #4.1 reads its output pin 1. Anything else is evaluated as an expression, such as Health * 2 + 1. |
source, loadedSources, visualScriptSources | Serve and list class listings. |
disconnect, terminate | Release the debugger and resume anything paused. |
Stop reasons are breakpoint, step and pause. Logpoint lines arrive as output events. The adapter does not support restart, step-back, hit counts, or data, function and exception breakpoints. Unknown requests get a failed response.
Next
- Calling C++: the calls you will watch fire.
- Flow control: the execution model the debugger pauses.
Engine sources
This page describes behavior implemented in these files of the engine repository, checked against commit 3f3a08d31.
- Engine/Source/Runtime/VisualScripting/Public/VisualScripting/VisualScriptDebugger.h
- Engine/Source/Runtime/VisualScripting/Public/VisualScripting/VisualScriptVM.h
- Engine/Source/Runtime/VisualScripting/Public/VisualScripting/VisualScriptExpression.h
- Engine/Source/Runtime/VisualScripting/Public/VisualScripting/VisualScriptDapServer.h