 Mowo
Debug views and debug drawing
Inspect intermediate buffers with view modes, draw debug lines and shapes from code, read GPU timings, and capture frames.
When a frame looks wrong, isolate the term that is wrong. The viewport's view modes show each intermediate buffer, the DebugDraw module draws lines and shapes from your own code, and the stat command and GPU markers tell you where the time goes.
View modes
Open the view-mode menu on the viewport toolbar. The modes are grouped:
| Group | Modes |
|---|---|
| — | Lit (Alt+4), Unlit (Alt+3), Wireframe (Alt+2) |
| Buffer Visualization | Base Color, World Normals, Roughness, Metallic, Ambient Occlusion, Depth, Velocity, Custom Depth, Custom Stencil |
| Optimization | Light Complexity, Overdraw, LOD Coloration, Emissive |
| Lighting | Detail Lighting (Alt+5), Lighting Only (Alt+6), Global Illumination, Reflections, Shadow Cascades |
| Reference | Path Tracing, see Ray tracing |
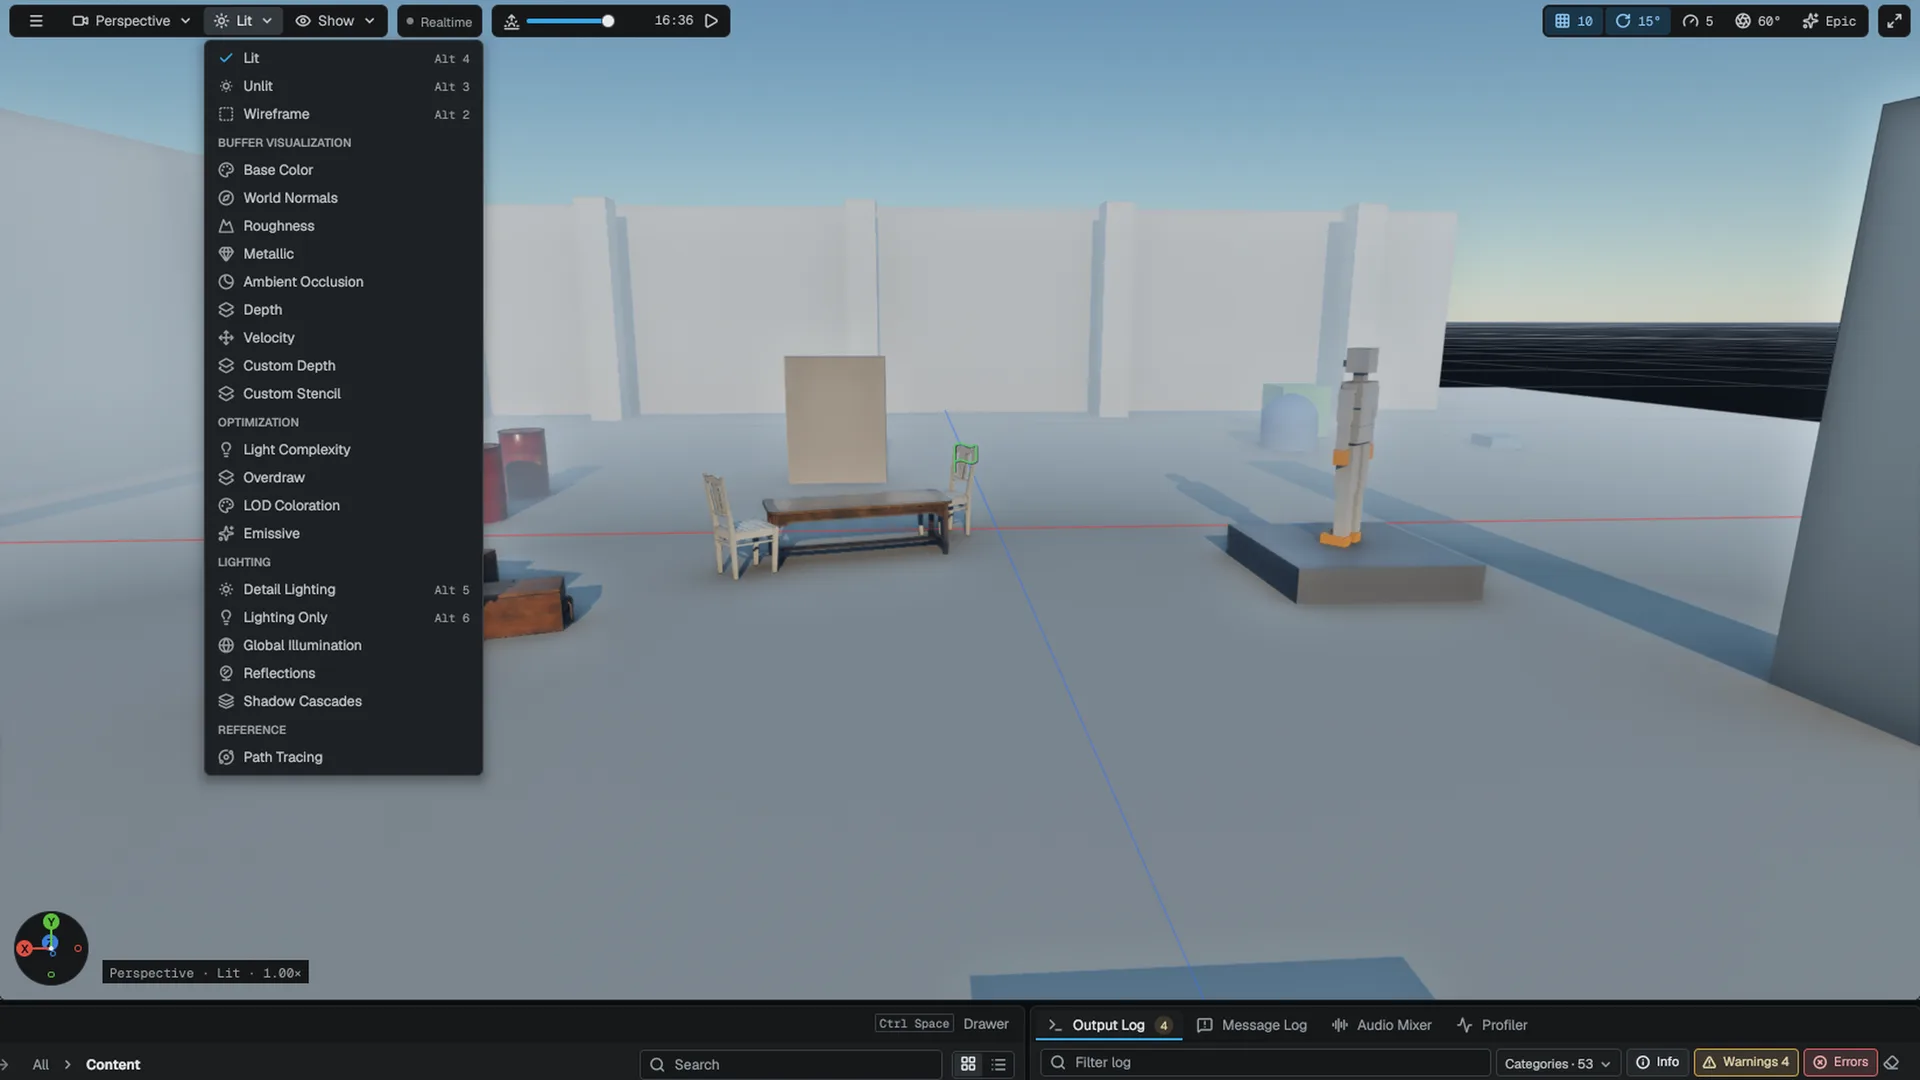
Outside the editor, set r.ViewMode: 0 Shaded, 1 Wireframe, 2 Unlit, 3 Normals, 4 Depth, 5 Roughness, 6 Metallic, 7 BaseColor, 8 Emissive, 9 AmbientOcclusion, 10 ShadowCascades, 11 DetailLighting, 12 LightingOnly, 13 Velocity, 14 GlobalIllumination, 15 Reflections, 16 PathTracing. The default, -1, lets the host decide.
A few systems have their own debug output:
r.TSR.Debugshows TSR's history weight, rejection or velocity. See Upscaling.- The SDF debug view shows the Global Illumination distance field. See Global Illumination.
r.ColorBlind.Simulatepreviews the image as a viewer with a color-vision deficiency sees it.
Draw debug shapes from code
The DebugDraw module is a thread-safe immediate-mode API (DebugDraw). Call it from any thread during a frame; the shapes appear that frame and are cleared after it.
#include "Tools/DebugDraw.h"

Mowo::DebugDraw& dd = Mowo::DebugDraw::Get();

dd.DrawLine(Mowo::Vec3(0.0f, 0.0f, 0.0f), Mowo::Vec3(0.0f, 2.0f, 0.0f), Mowo::Vec4(1.0f, 0.0f, 0.0f, 1.0f));
dd.DrawSphere(Mowo::Vec3(0.0f, 1.0f, 0.0f), 0.5f, Mowo::Vec4(0.0f, 1.0f, 0.0f, 1.0f), 16);

Mowo::FDebugLineStyle style;
style.Thickness = 3.0f;
style.Halo = 1.0f;
style.Priority = Mowo::EDebugDepthPriority::Foreground;
style.Lifetime = 2.0f;

dd.DrawThickArrow(Mowo::Vec3(0.0f, 0.0f, 0.0f), Mowo::Vec3(2.0f, 0.0f, 0.0f), Mowo::Vec4(1.0f, 1.0f, 0.0f, 1.0f), style);
There are two kinds of primitive:
- Thin lines:
DrawLine,DrawRay,DrawArrow,DrawBox,DrawSphere,DrawCapsule,DrawCircle,DrawArc,DrawGrid. One pixel wide, cheap enough for hundreds of thousands of edges such as a navmesh.SetDepthTestEnabledorDrawLineWithDepthTestdecides whether geometry hides them. - Thick primitives:
DrawThickLine,DrawThickPolyline,DrawThickCircle,DrawThickBox,DrawThickSphere,DrawThickCapsule,DrawThickCone,DrawThickFrustum,DrawThickArrow,DrawScreenPointandDrawSolidTriangle. They are anti-aliased and sized in screen pixels, so they read the same at any distance.FDebugLineStylesets the thickness, a dark Halo that keeps a color readable over a background of the same brightness, the depth Priority and a Lifetime in seconds (0 this frame only, negative untilClearPersistent).
Depth priority World hides a primitive behind opaque geometry; Foreground always draws it, with the hidden part dithered so it reads as behind. The editor's transform gizmo and component visualizers use the thick primitives.
Debug drawing goes on the final image after tonemapping and anti-aliasing, so colors reach the screen exactly as authored and lines never smear into the temporal history.
Categories
Debug drawing is grouped into categories: General, Perception, Navigation, Physics, Audio, Bounds, Director and Cover (EDebugDrawCategory). Turn a category off with SetCategoryEnabled, and tag your own drawing with an FDebugDrawCategoryScope so it follows that category's switch.
GPU timings
stat fps,stat unitandstat gpushow frame rate, frame times and the per-pass GPU breakdown.stat nonehides them;stat listshows every group.r.GpuTimingsrecords per-pass GPU timestamps. It is on by default indebug,devanddebuggamebuilds and off inreleaseandprofile.r.LogGpuTimings Nlogs the pass timings every N frames, useful in headless runs.r.GpuMarkers(default 1) names every GPU scope so PIX, RenderDoc, Nsight and Xcode captures show the pass names.- On Metal,
r.Metal.CaptureFrame 1writes the next frame to a.gputraceyou can open in Xcode. Launch withMTL_CAPTURE_ENABLED=1.
See Console commands for stat and its subcommands.
Capture a frame
A development build of the game can render a scene, write a screenshot and exit:
MowoGame.exe --project=MyGame.mproject --scene=Content/Maps/MyMap.mmap --screenshot=out.png --screenshot-frame=90--screenshot-frame (default 90) is the frame to capture. Combine it with --cvar=r.ViewMode=14 to capture a single buffer, or with r.PathTracer.Enable for a converged reference. Release builds drop these switches.
API reference
- DebugDraw module:
DebugDraw,FDebugLineStyle,EDebugDrawCategory
Engine sources
This page describes behavior implemented in these files of the engine repository, checked against commit 7f8f31f8d.
- Engine/Source/Runtime/DebugDraw/Public/Tools/DebugDraw.h
- Engine/Source/Runtime/RHI/Public/RHI/DebugDrawRenderer.h