 Mowo
Profiling
Measure a running editor, game or server with stat commands, cycle counters, per-frame CSV captures, Tracy, whole-run traces and MowoInsights.
The profiling tools work the same in the editor, a development game and a dedicated server. There is no separate profiling build. Start with stat unit to see where a frame goes, then narrow down with counters, a capture or a trace.
stat commands
Type them in the editor's Output Log console or the game console, or call IConsoleManager::Get().Execute("stat unit") from code.
| Command | Shows |
|---|---|
stat fps | Frame rate and mean frame time |
stat unit | The frame, game, draw, RHI and GPU times |
stat gpu | Per-pass GPU times from the last resolved frame |
stat memory | Live bytes per memory tag (needs a --memtrack build) |
stat hitches | Frame-time percentiles and hitch counts |
stat hardware | CPU and GPU load, clocks, temperature, power, throttling, VRAM and process memory (Hardware telemetry) |
stat net | Ping, jitter, packet loss, bandwidth and the server tick |
stat <group> | A stat group's cycle counters as a table |
stat none | Hides every display |
stat list | Logs every group and counter |
stat dump | Logs the counters that recorded something last frame |
stat enable <group>, stat disable <group> | Turns a group's measurement on or off |
stat startfile [path], stat stopfile | Writes one CSV row per frame: frame number, time and deltas |
The display commands toggle, so typing stat fps twice turns it off. Values are coloured against the frame budget (16.67 ms by default, FFrameStats::SetBudgetMs): amber past it, red past twice it. Hitches are counted at 1.5×, 2× and 4× the budget.
What stat unit measures
| Row | Span |
|---|---|
frame | The whole loop iteration |
game | Tick: gameplay, systems, scene update |
draw | Everything after Tick: Draw, the overlay, submission and present |
rhi | Frame setup before Tick |
gpu | GPU time of the last resolved frame; n/a when the backend has no timers |
stat.FrameStats <N> logs averaged CPU stage times and the GPU frame time every N frames, without the overlay.
Cycle counters
Stat groups are declared in Core/EngineStats.h: Game, Render, RHI, Physics, Audio, Animation, AI, UI, Particles, Network and Asset. Counters live with the code they measure: Engine/Source/Runtime/Core/Public/Core/EngineStats.h
#include "Core/EngineStats.h"

MOWO_DEFINE_LOCAL_CYCLE_STAT(SpawnWave, AI);

void SpawnWave() {
	MOWO_SCOPE_CYCLE_COUNTER(SpawnWave);
}
To share a counter between files, declare it in a header with MOWO_DECLARE_CYCLE_STAT(MYGAME_API, TickAI, AI) and define it in one .cpp with MOWO_DEFINE_CYCLE_STAT_API(MYGAME_API, TickAI, AI). A scope records inclusive time, self time and a call count, per thread. With its group disabled a scope costs one atomic load.
MOWO_PROFILE_SCOPE("Name") marks a profiler zone instead; zones feed Tracy, the CSV profile, the editor's Profiler panel and traces.
Per-zone CSV capture
--csvprofile=<file> writes one row per frame and one column per profiler zone (the summed milliseconds of every zone of that name), after frame,frameMs,gpuMs. Diff two captures zone by zone to find a regression.
The capture turns on the profiler, which takes a lock per scope and changes thread timing. Judge timing-sensitive crashes from a run without it.
Tracy
Tracy is compiled in by default in dev and profile builds on Windows and macOS, idle until a viewer connects. Elsewhere it is opt-in with -o MOWO_ENABLE_TRACY=true, and =false turns the default off. Run tracy-profiler on the same machine and connect to the running game or editor. The client listens on loopback only, so it opens no port to the network and the viewer must run locally.
Game code profiles with the macros in Core/Profiler.h and never includes a Tracy header: the engine hosts the one Tracy client and the macros reach it through functions it exports, so a game module built against the installed engine compiles and records zones the same way. Where Tracy is compiled out, so is the Tracy half of every macro; zones still feed the CSV profile, the Profiler panel and traces. Engine/Source/Runtime/Core/Public/Core/Profiler.h
#include "Core/Profiler.h"

void AWaveSpawner::Tick(float deltaTime) {
	MOWO_PROFILE_FUNCTION();
	MOWO_PROFILE_PLOT("Waves/Alive", static_cast<int64_t>(m_alive.size()));
}| Macro | Records |
|---|---|
MOWO_PROFILE_SCOPE(name), MOWO_PROFILE_FUNCTION() | A zone until the end of the scope; the name may be a runtime string |
MOWO_PROFILE_RENDER(name), _PHYSICS, _AUDIO, _SCRIPT, _INPUT, _SCENE, _ASSET, _UI, _ECS, _MEMORY | A zone in that category's colour |
MOWO_PROFILE_PLOT(name, value) | A value over time; value is an int64_t, double or float |
MOWO_PROFILE_MESSAGE(text, size), MOWO_PROFILE_MESSAGE_L(literal) | A message on the timeline |
MOWO_PROFILE_ALLOC(ptr, size), MOWO_PROFILE_FREE(ptr) | An allocation and its free, for Tracy's memory view |
MOWO_PROFILE_MUTEX(name, description) | A mutex member Tracy draws on its lock timeline; lock it as std::lock_guard<Mowo::FProfiledMutex> |
Whole-run traces
A trace records every frame of a run (CPU scopes per thread, GPU passes, memory tags and the stat unit phases) to a .mtrace file you open afterwards:
MowoGame.exe --trace=Saved/Profiling/Run.mtrace--trace=<file> sets the mowo.Trace.File console variable at start-up; setting it from the console starts a trace mid-run, and setting it empty stops it. A writer thread encodes the frames, so the game thread only queues them; if the writer falls behind, frames are counted as dropped instead of stalling the game. Past mowo.Trace.MaxSizeMB (2048 by default) the trace continues in Run_001.mtrace, Run_002.mtrace and so on. A trace from a process that crashed keeps every whole frame before the crash.
Publish your own per-frame numbers with FTraceWriter::Get().SetCounter("DrawCalls", n); MowoInsights plots them.
MowoInsights
MowoInsights is the standalone viewer for .mtrace traces and .mprof captures, the equivalent of Unreal Insights. It needs no editor and no project.
./mbt.cmd build -t MowoInsights
MowoInsights.exe Saved/Profiling/Run.mtrace
MowoInsights.exe --open=Run.mprof
You can also drop a file on the window or use Open…; Reload rereads a trace that is still being written.
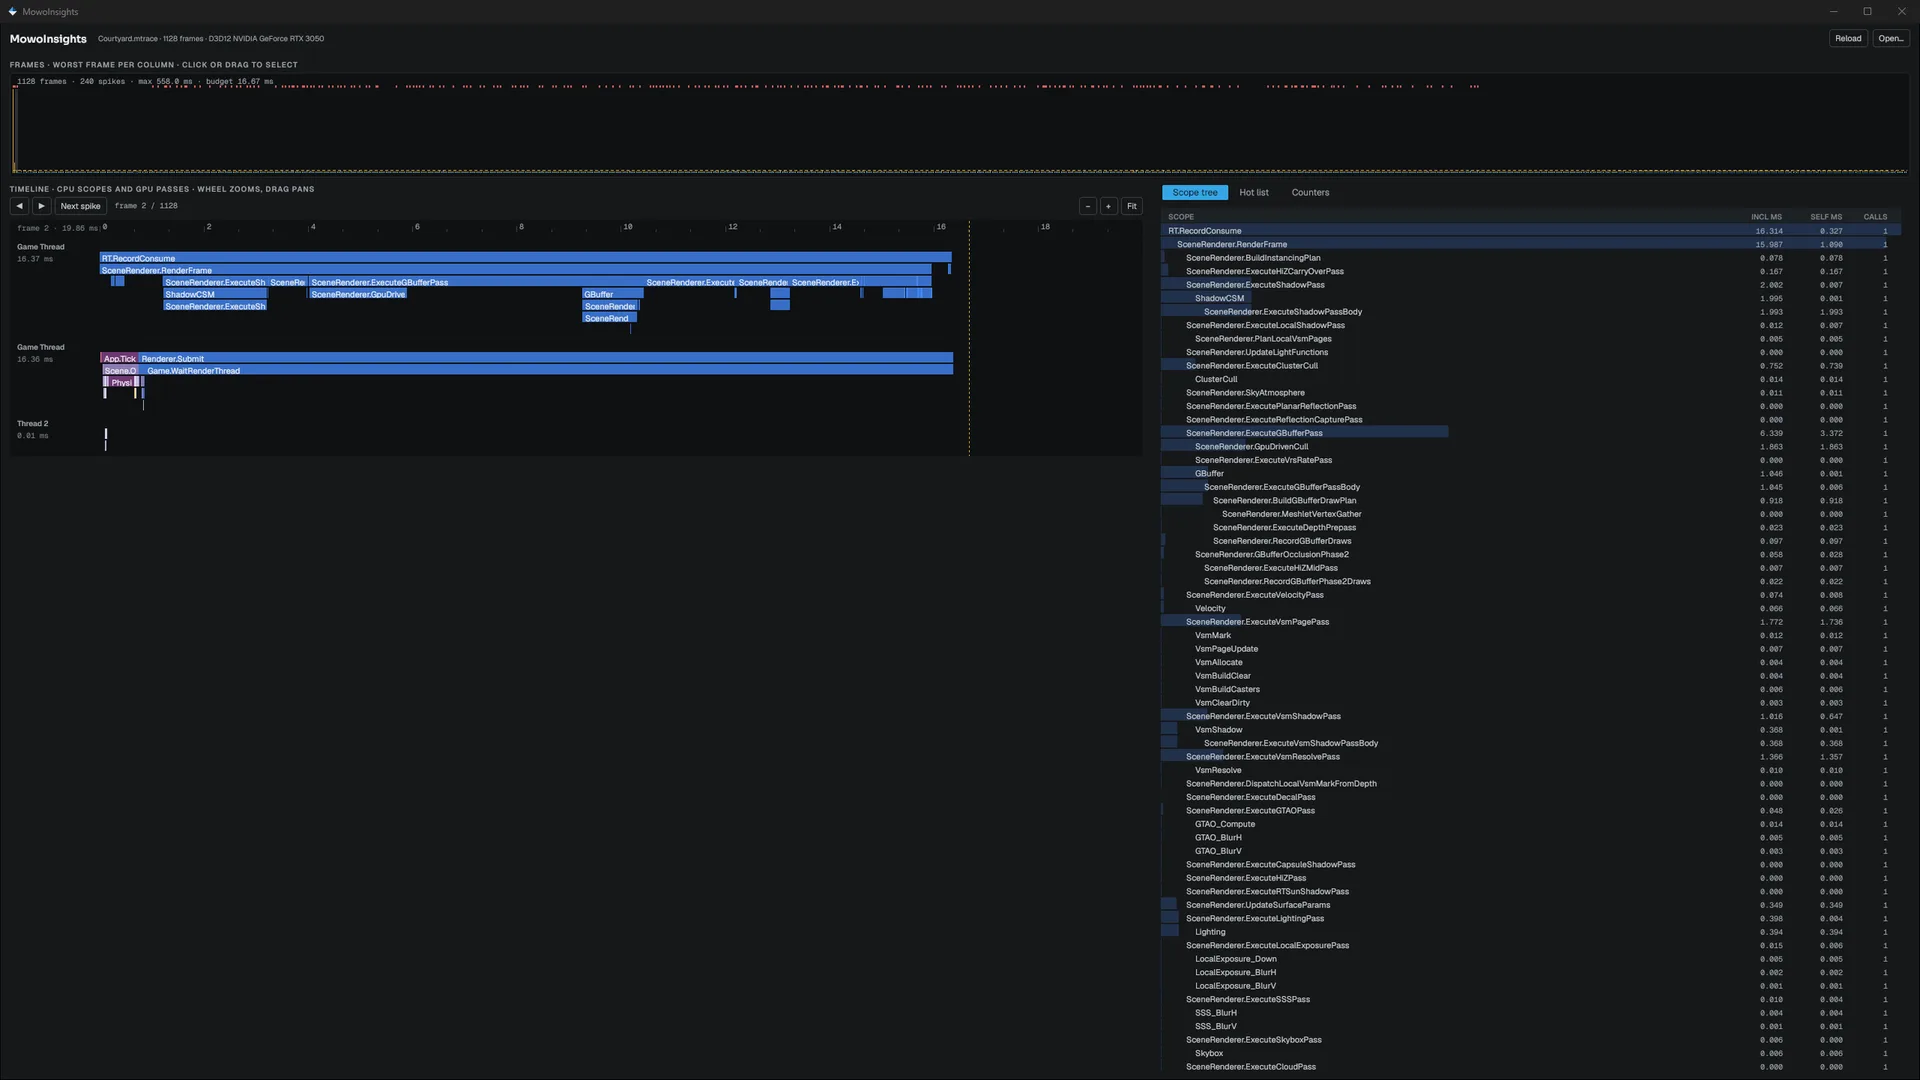
- Frames: every frame as a bar against the budget line, spikes marked in red. When there are more frames than pixels, each column shows the slowest frame it covers.
- Timeline: the selected frame's lanes, one per CPU thread and one for the GPU. Next spike jumps to the next spike; Fit resets the zoom.
- Scope tree: inclusive and self milliseconds and call counts for the selected frame.
- Hot list: every scope summed over the trace, sorted by self time.
- Counters: frame, game, draw and GPU times and every published counter, plotted over the trace.
Retained frames in the editor
The editor's Profiler panel keeps a ring of recent frames you can scrub after a spike has passed, and saves it as .mprof. The ring is disarmed until the panel records, because copying every scope each frame has a cost. In a game or on a server, mowo.Profiler.Capture 1 arms it. See Editor.
Memory
stat memory reads the memory tracker, which is compiled out of normal builds. Build with mbt build --memtrack to get live bytes, peak and allocation counts per tag. Tag your own allocations with MOWO_LLM_SCOPE(tag).
Engine sources
This page describes behavior implemented in these files of the engine repository, checked against commit 77b5ea1b2.
- Engine/Source/Runtime/Core/Public/Core/EngineStats.h
- Engine/Source/Runtime/Core/Public/Core/FStats.h
- Engine/Source/Runtime/Core/Public/Core/FFrameStats.h
- Engine/Source/Runtime/Core/Public/Core/FCsvProfile.h
- Engine/Source/Runtime/Core/Public/Core/Profiler.h
- Engine/Source/Runtime/Core/Public/Core/ProfilerCapture.h
- Engine/Source/Runtime/Core/Public/Core/TraceWriter.h
- Engine/Source/Runtime/Core/Public/Core/FMemoryTracker.h