 Mowo
Profiler and debug views
Record and scrub recent frames in the Insights profiler, find hitches with the Frame Timeline, export and open traces, and use the render debug view.
The editor's profiler reads the timing recorders the engine already has and keeps the last few hundred frames, so you can go back and look at a hitch after it happened. Open it with Window ▸ Debug ▸ Profiler; it opens as a tool document titled Insights, beside the level. For the recorders themselves and the stat commands, see Programming.
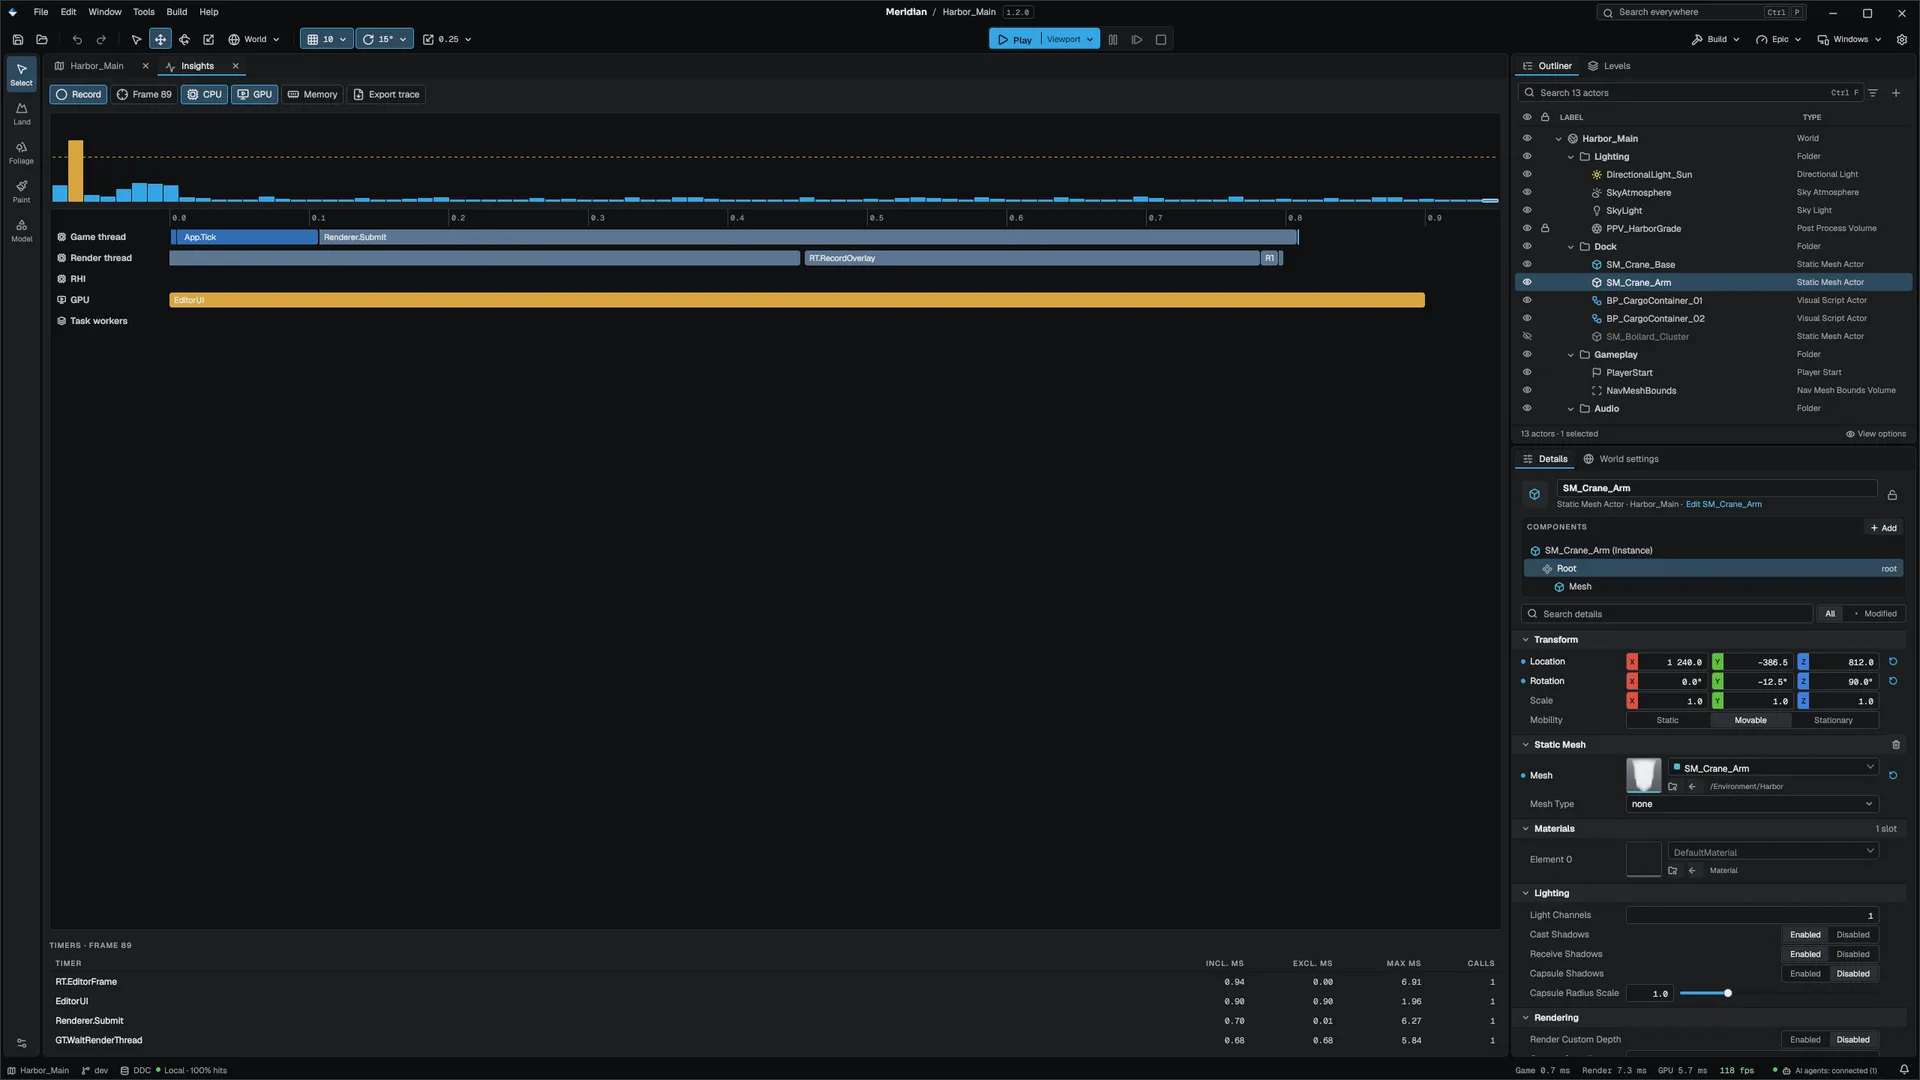
What it shows
| Part | What it shows |
|---|---|
| Toolbar | Record, Frame N (reads Live while following the newest frame; click to go back to live), CPU, GPU and Memory toggles, Export trace |
| Frame chart | One bar per retained frame against the dashed 16.67 ms budget. Click a bar to select that frame |
| Timeline | The selected frame, one track per thread: Game thread, Render thread, RHI, GPU, and Task workers (every other thread folded into one). Click to set the playhead; Ctrl + wheel zooms |
| Timers | The frame's scopes and GPU passes summed by name: inclusive ms, exclusive ms, Max ms (the worst time that name took in any retained frame) and calls. Click a header to sort; Ctrl+F filters |
With Memory on, the table shows memory by tag (live, peak, budget, count). Memory tracking is compiled out of a normal build, so the table is empty there; build with mbt build --memtrack to see live bytes per tag.
GPU timings arrive a frame or two late, which is the cost of timestamp queries. Passes on the async-compute queue carry no timestamps, so the GPU track shows the graphics queue only.
Recording and scrubbing
Record starts both the scope recorder and the capture ring. The ring keeps the last 300 frames. It runs only while the profiler is on screen and Record is on, because copying every sample each frame has a cost. Set mowo.Profiler.Capture 1 to record without the panel, for example in a packaged build or a scripted run.
Selecting a frame freezes the ring so the frame does not slide away while you read it. Frame N or Follow newest frame (right-click menu) goes back to live. Clear capture empties the ring.
Traces
Export trace writes every retained frame to Saved/Profiling/Capture.mprof. Open trace… (right-click menu, or the empty state) reads one back into the same ring, so a trace a colleague sent you scrubs exactly like a live capture. A .mprof is a text file: one block per frame with its timings, scopes, GPU passes, memory tags and counters, plus the graphics API and device it was taken on.
Frame Timeline
Window ▸ Debug ▸ Frame Timeline is a compact timing view over the same capture ring; it records nothing unless the profiler's Record (or mowo.Profiler.Capture) is on.
- Frames: per frame, three bars side by side for the game thread, the draw phase and the GPU. A red tick marks a spike. Click or drag to select a frame; the profiler then shows the same frame. Live follows the newest frame.
- Track: the selected frame's scopes and GPU passes over time, one lane per thread, every call as its own block. The wheel zooms around the cursor, dragging pans, and hovering a block shows its start, duration, lane and share of the frame.
- Spikes: frames more than twice the median and more than 2 ms above it, each with the lane that grew most and its widest scope. Click a row to select the frame.
Render Debug
Window ▸ Debug ▸ Render Debug shows the level viewport's view modes as a grid you can click: buffer visualizations (base colour, normals, roughness, metallic, ambient occlusion, depth, velocity, custom depth and stencil, emissive), lighting views (detail lighting, lighting only, Global Illumination, reflections, shadow cascades, light complexity) and the optimization views (overdraw, LOD coloration), with Reset to Lit. The same modes are on the viewport's view-mode menu (Viewport).
Related
- Network debugging for multiplayer sessions.